Analytics
Dashboard - Reports and Analytics
Log in to your Kommunicate dashboard account and go to the Dashboard section to see the analytics.
You can see your customer support analytics, team, and agent-wise performance in Kommunicate Dashboard. You can analyze these metrics:
| Support Metric | Descriptions |
|---|---|
| Old | Conversations that were created before the selected date range and still not yet started, opened, or re-opened. |
| New | New conversations created in the selected date range. |
| Total | The total number of conversations handled in the selected date range. |
| Open | The number of conversations that are still open in the conversation section. |
| Resolved | The number of total incoming conversations that have been closed. |
| First Response Time | FRT is the time elapsed between the user's first message and agent's first reply to that message. It is averaged over for all conversations. |
| Resolution Time | Resolution time is the time elapsed between the user's first message and the time when the conversation was marked closed. It is averaged over for all closed conversations. |
| Users waiting for a response | The total number of users waiting for the first response. |
| Not yet started | Users opened the chatwidget, but not started the conversation yet. |
AI agent Analytics
You can view the performance to your AI agents based on the date filtered.
AI agent Intent Analytics
Gain insights into user preferences by exploring this breakdown of intent usage. Use these insights to refine your AI agent's responses and better serve user needs.
AI agent Messages
This section will show the AI agent intents and their corresponding messages, along with categories - Intent, Fallback, Handoff, Smalltalk, and the triggered sentences when any of these categories occurred. It will be useful to analyze the handoffs as well.


AI agent Message with categories

Company-wide data
See company-wise analytics from here. We have a custom date filter available in the reports. You can specify the timeline and check the analytics for that specified timeline.

Analyze 24-hour distribution
Check the box 'Show 24-hour distribution' to analyze your peak and relaxed hours.
Note: All timestamps are in your browser/system timezone.

Agent-wise Analytics
You can select any of your agents to analyze their performance. You can check the total conversation assigned to them, how many are waiting for a response, and how many of them have been closed. You can also check their First Response Time and Resolution Time.

You can also refer to the Agents' table for a better understanding:

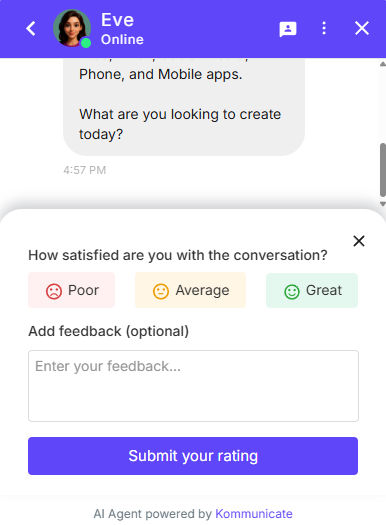
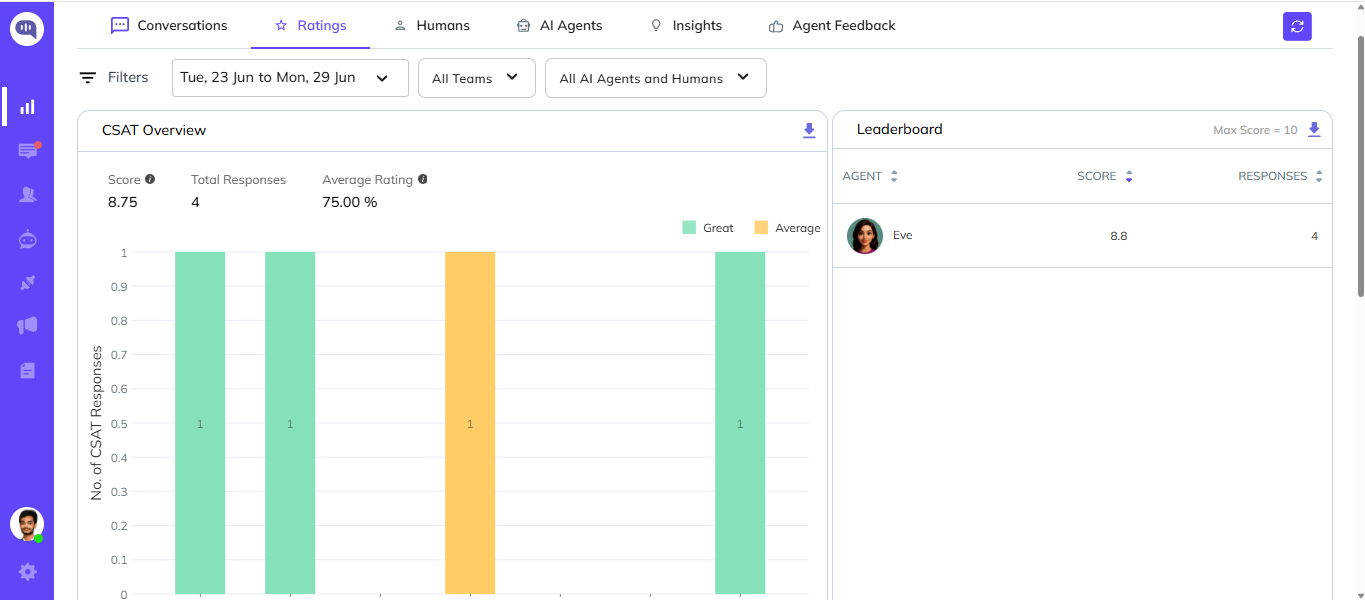
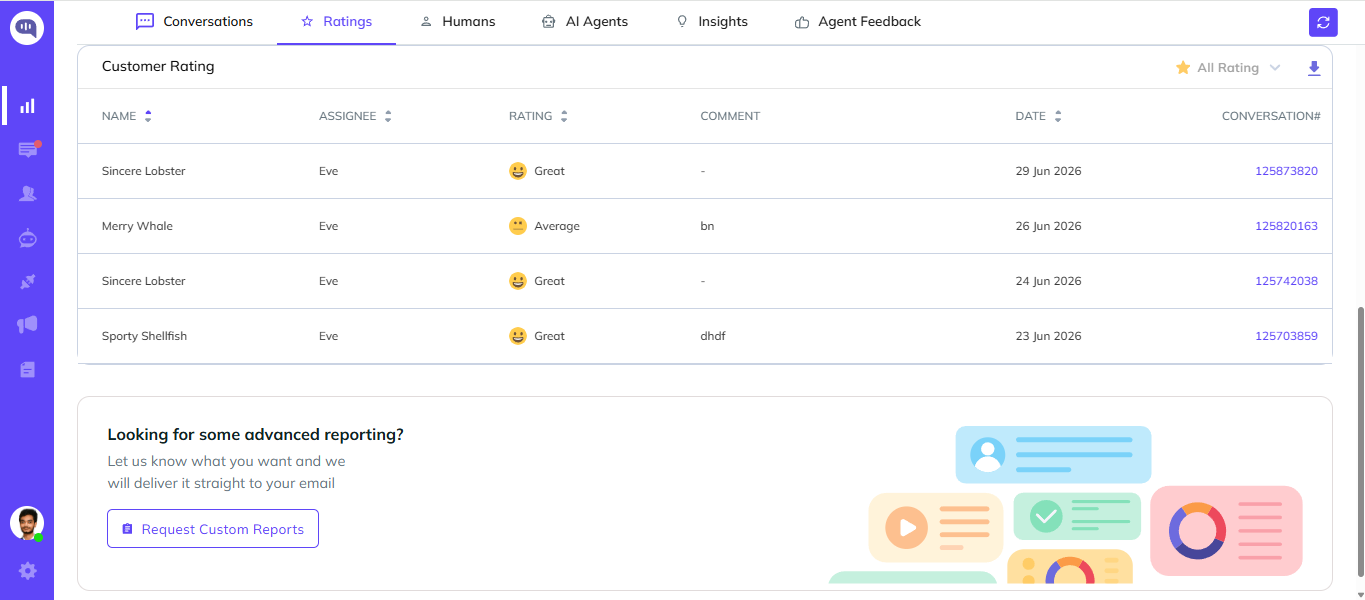
CSAT Ratings
Customer Satisfaction (CSAT) surveys assess customer satisfaction with the quality and effectiveness of your support.
You can implement it on your website/app to improve the support based on the feedback. see this page to enable it from the dashboard.
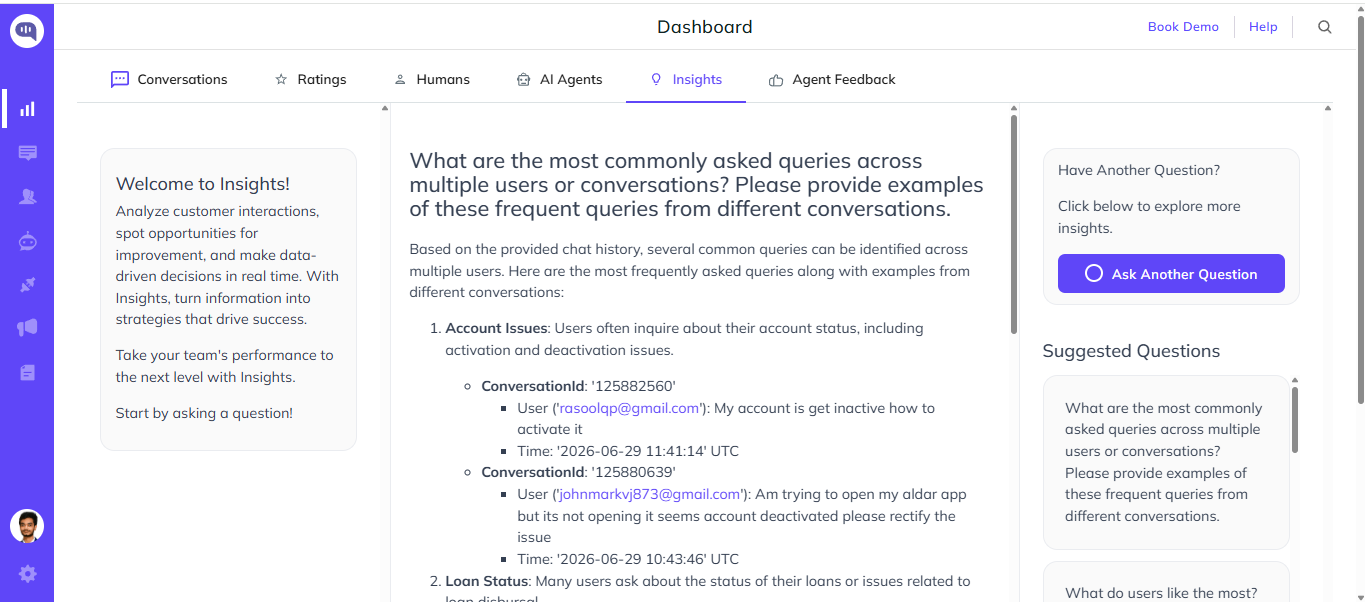
Insights
Evaluate customer interactions to identify areas for growth and make informed decisions instantly. With Insights, transform data into actionable strategies that propel success. This feature helps you to uncover trends, streamline processes, and optimize your approach.
Enhance your team's performance with Insights. You can ask your question in the space provided or you can choose from one of our prebuilt questions.
We will show a detailed analysis which includes the conversation links which you can refer to